Overview
Heron Data’s main use case is to help lenders and fintechs underwrite SMBs using bank data. We do this by enriching each transaction with a category identifying the transaction (e.g.,Revenue or Debt Investment), and then aggregating amounts across these labels to give insights into the company.
The key outcomes we achieve for our customers are:
- Supercharge underwriters: Speed up underwriting by an order of magnitude vs. having to manually parse bank data
- Expand addressable market: Underwrite businesses without up-to-date accounting or e-commerce data
- Catch fraud: Because bank data is up-to-date, we have enabled customers to avoid millions of dollars in losses to customers who were loan stacking or had other previously unidentified risk factors
Post & enrich company bank data
Create an end user and enrich transactions
- Create an end_user: Begin by creating an end_user in Heron’s systems that corresponds to a company/applicant in your systems. You do this by sending a POST
end_usersrequest.- For the
end_user_idfield, use a canonical reference/identifier for the company - Note: If you are sending transactions for a company that you’ve already sent to Heron before, skip this step.
- For the
- Send Transactions to Heron Once you have created the end_user, you can start sending us transactions in many ways
- Set up a Direct Plaid Integration - this is recommended if you use Plaid and want to perform ongoing portfolio monitoring. By setting up a Direct Plaid Integration, we will automatically retrieve new transactions automatically from Plaid whenever there is an update, without any manual intervention required. Steps to set up this integration can be found here
- Send PDF bank statements - note: this will incur a separate fee per bank statement and PDF parsing must be enabled for your account prior to uploading the documents. Steps to set up this integration can be found here
- Send system output files - Heron can accept certain files directly without any manipulation. For example, if you use Plaid but do not wish to integrate Heron directly to Plaid, then you can send us Plaid reports instead
- POST transactions via API
- If you want to send us transactions directly from your system, you can POST transactions for a given end_user using the
/end_users/{end_user_id}/transactionsendpoint for sending requests. - Note: Please batch up to 20k transactions per request
- If you want to send us transactions directly from your system, you can POST transactions for a given end_user using the
- Process Transactions: When you are done sending us transactions for a company, please send a PUT
end_usersrequest, indicating that the end_user isreadyfor processing.- Note: if you have set up a Direct Plaid Integration or are sending Heron PDF bank statements, skip this step.
- Listen to webhook: We will notify you via a webhook when the
end_user_idisprocessed, and available for you to retrieve. You can configure your webhook in the dashboard. - Get transactions: Once you have received the webhook, you can send a request to retrieve the enriched transaction data.
- Note: We still support the
/transactionsendpoint that was previously used by most customers. The new endpoint that is now standard is much more performant, so we recommend using that endpoint instead. If using the old endpoint, you can use theend_user_idparameter to ensure you only pull transactions for theend_user_idthat was just enriched. If you get transactions for a company that you’ve already sent to Heron before, you can use thelast_updated_minfilter to only get transactions where labels have changed since the last time you send and fetched transactions.
- Note: We still support the
Inspect company using the dashboard
This section only describes the dashboard at a very high-level. To get more detailed information, please contact Heron Data for an onboarding session During your integration, you can use the dashboard to make sure that all steps work as expected.- Navigate to the
All Companiespage. This will give you an overview over the companies (i.e.,end_user) you have created.
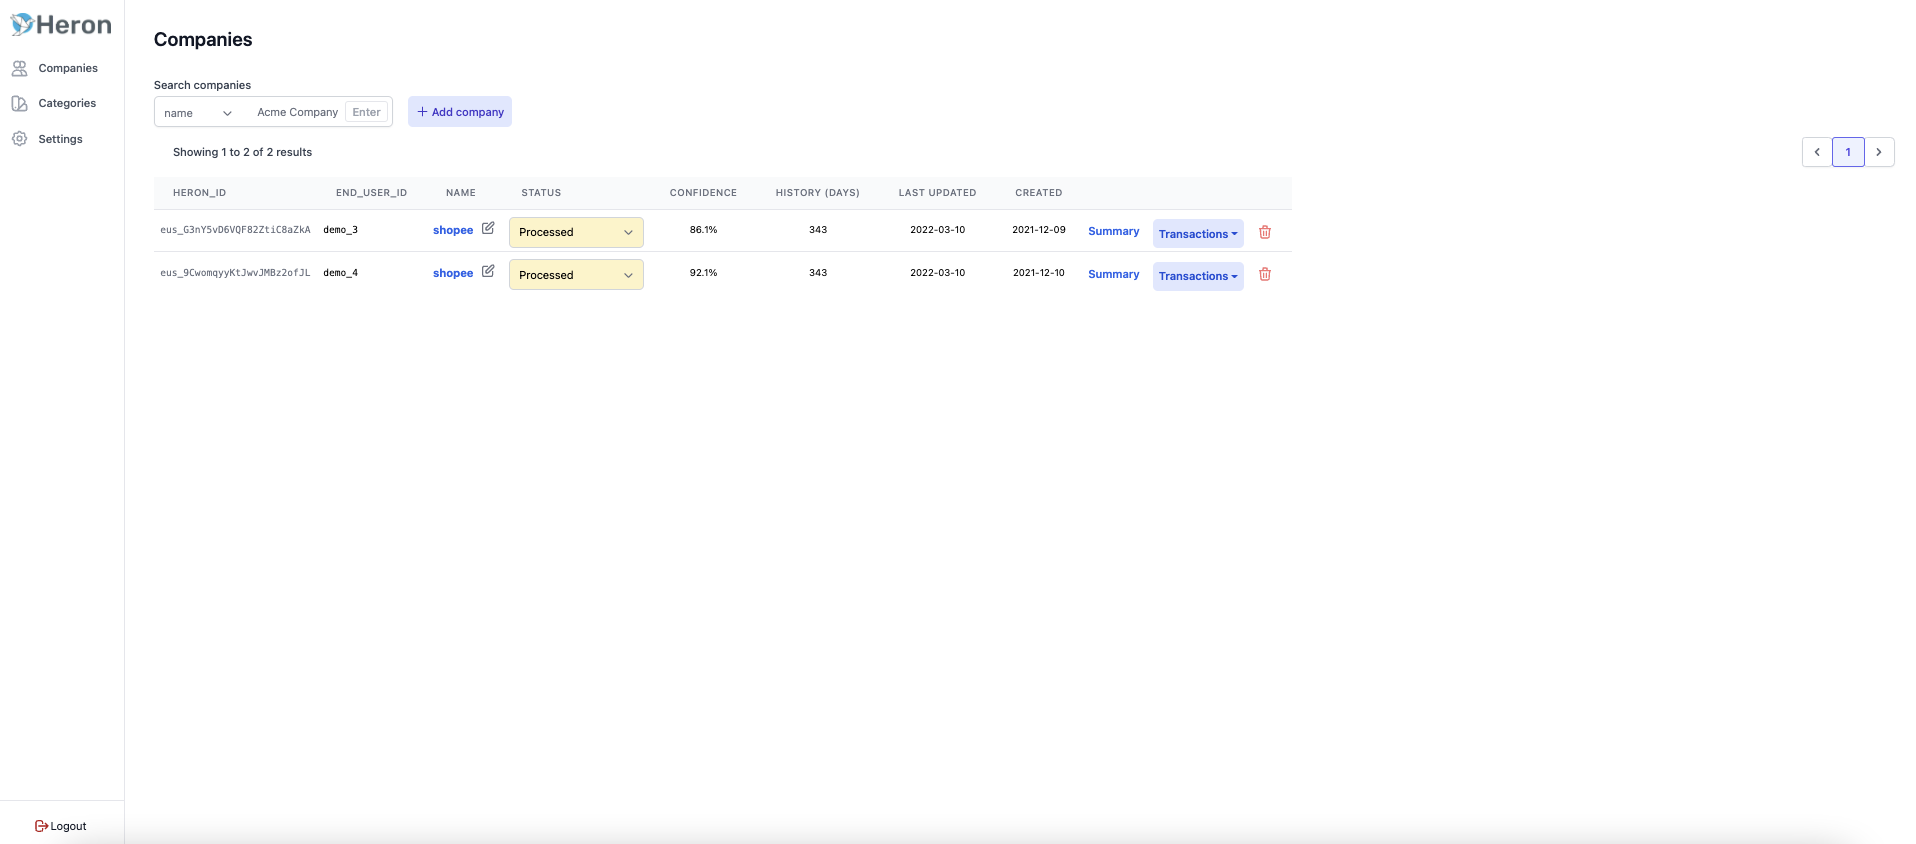
- You can see the status of the company in the
statuscolumn of the main table. To view the generated reports for a company, click on the companies’name. - To ensure that the reports are suitable for underwriting, confirm that the three sets of data quality checks have passed for the company (i.e. Data Sources, Accounts, Transactions).
- To view the data checks, click on the applicable application component on the left hand panel and then
Data Checksat the top
- To view the data checks, click on the applicable application component on the left hand panel and then
- If all of the Data Quality checks have passed, navigate to one of the
Underwriting Reportsfor one of the companies. Here, you will see multiple reports that visualize Deposits, Withdrawals, Debt, Revenue, P&L, risk flags and other financial metrics about the company. - To inspect the transactions uploaded, click on the
transactionsbutton on the left. - To verify all possible categories that your model may attach to transactions, navigate to the
Categoriestab. You can inspect all labels there.
Retrieve aggregate metrics on a company
Instead of consuming the enriched transaction data, it may be easier to consume aggregated metrics for a given company. For example, you may want to see monthly historical revenue for a company, as estimated by Heron Data. We allow you to do this by downloading either self-contained reports (e.g. Bank Statement Summary, Cash-Based P&L), certain aggregate metrics contained in our Heron Scorecard, and/or historical time series and forecasts per category label.Get Heron Scorecard
We have aggregated the most common metrics calculated on top of Heron Data output in our Heron Scorecard. The Scorecard will allow you to quickly evaluate a company, by providing labels such as: To get the Heron Scorecard, send a GETend_users/{end_user_id_or_heron_id}/scorecard request.
- Data Quality: Measures to help you understand the quality and completeness of the bank data our analysis is based on, e.g.
Data Coverage&Data Freshness. Also includes a measure to see what percentage of all transactions (as a proportion of revenue) appear to be going to an unconnected account held by the company we are analysing. - Risk Flags: Flags like
ATM Cash Withdrawalsand distinct days with insufficient funds / overdraft fees. - Balance: Statistics about average, max and min balances.
- Profit & Loss: Approximations of standard cashflow-based metrics like
Revenue,Net Operating Cashflow, etc. - Debt: Number, recency and amounts of recent debt investments and repayments
Get historical timeseries
To get historical time series, (e.g.Revenue over time for each month), send a GET end_users/statistics request. In the parameters, you can specify:
- The
end_user_idof the company you are looking at - The time periods over which you want to aggregate, often this is per month (
date_granularity) - Whether you want to pivot by
merchant,categoryor both - If you want to see only certain categories, filter by
category_heron_ids
12345 you would send a GET request to the following:
Get forecast
To get forecasts for a category timeseries, send a GETend_users/forecast request. You can use similar logic to the historical timeseries section above to get forecasts for the time intervals and category labels you care about.
For more information on forecasts and any feedback, please talk to us!